The 5 Best Tools for Scientific Diagrams in 2026
September 6, 2026
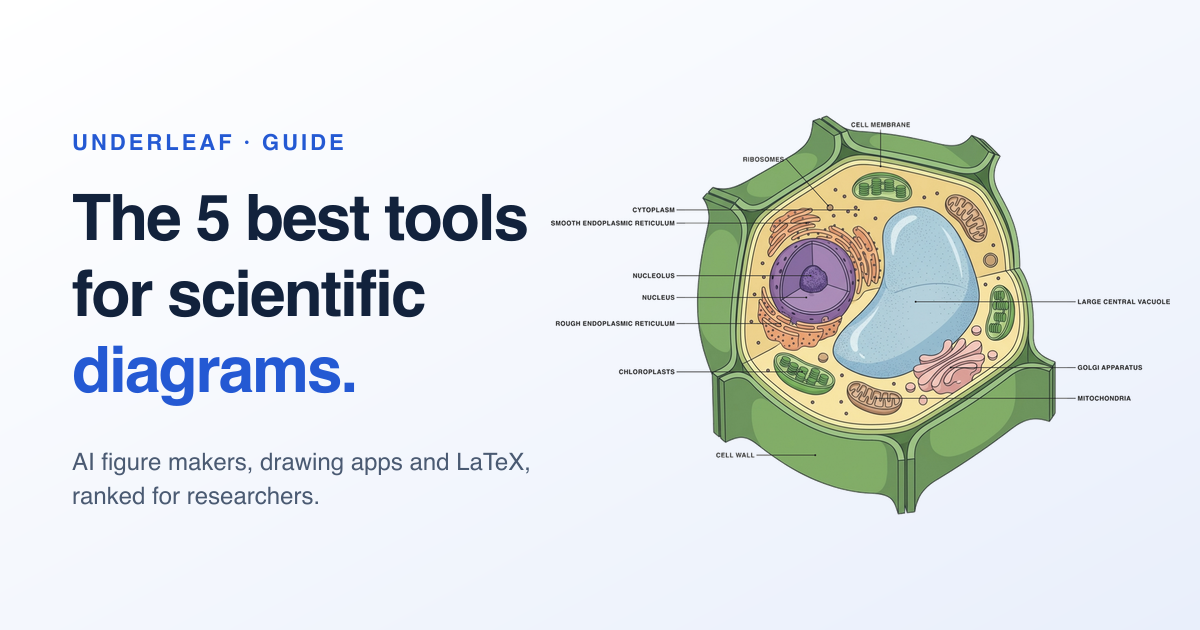
A scientific diagram has one job: make a structure, a process or a result understandable at a glance. The tool you pick decides how long that takes, how accurate the drawing is, and whether you can change it next week without starting over. We ranked five options researchers and instructors actually use, from AI figure makers to general-purpose drawing apps, on accuracy, editability, speed and cost.
Quick comparison
| Tool | Best for | Editable labels | Free to start |
|---|---|---|---|
| Underleaf Figure Maker | Labeled biology and math illustrations for papers and lectures | Yes | Yes |
| ChatGPT image generation | Quick concept sketches and brainstorming | No | Yes |
| Canva | Posters and slides built from icon libraries | Yes | Yes |
| Inkscape | Fully hand-drawn vector figures | Yes | Yes |
| TikZ in LaTeX | Schematics and geometry that live in the manuscript source | Yes | Yes |
1. Underleaf Figure Maker
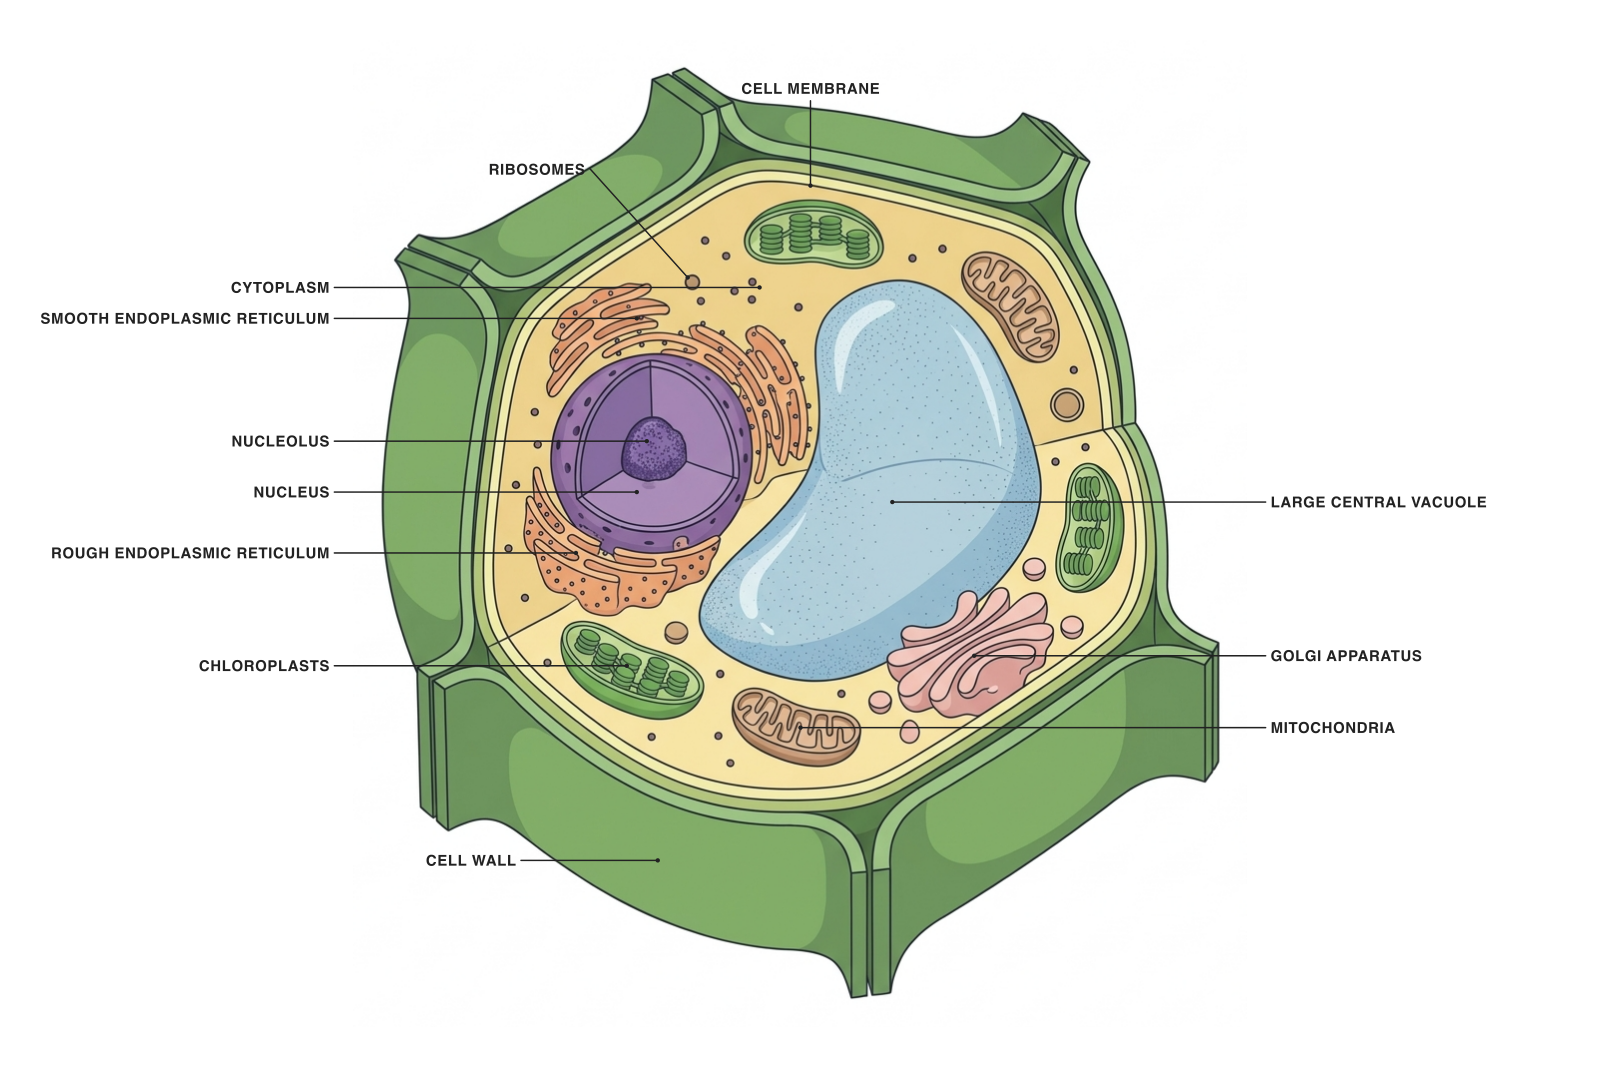
Figure Maker turns a plain-language description into a textbook-style illustration and then puts every label on a live canvas. Describe a plant cell, a neuron or a torus, and you get a drawn figure with the structures labeled and the labels placed outside the artwork where they stay readable. Drag a label to move it, drag the dot at the end of its line to point it somewhere else, rename it, or ask for a change to the illustration itself in a sentence.
- Strengths: accurate labeled diagrams in a minute, editable labels, a free example gallery, and the same account you use for your LaTeX tools.
- Limits: exports are PNG, and each new illustration or AI edit uses credits. Structural edits regenerate the artwork, so review the figure after each change.
- Best for: cell and anatomy diagrams, teaching figures with labeled and unlabeled versions, and math illustrations for lecture notes.
Start with the Figure Maker overview or open a labeled diagram from the library.
2. ChatGPT image generation
General-purpose image models are the fastest way to get a rough picture of an idea. Ask for a mitochondrion and you will get something that looks like one. The problems start when the figure has to be correct: text inside the image is often misspelled or invented, structures are sometimes fused or duplicated, and there is no way to move a single label without regenerating the whole picture.
- Strengths: instant, free to try, good for exploring what a figure could look like before committing.
- Limits: no editable labels, unreliable text, and precise iteration is hard. Treat the output as a sketch, not a submission.
- Best for: brainstorming compositions and talking through a figure with a coauthor.
3. Canva
Canva is a layout tool with a large icon and illustration library. For a conference poster or a lecture slide that needs a tidy arrangement of generic shapes, it is quick and forgiving. The catch is that the library was not drawn for science: an icon of a cell is decorative, not anatomically consistent, and you will not find a specific organelle or a labeled cutaway when you need one.
- Strengths: easy drag-and-drop layout, templates, collaboration, export in common formats.
- Limits: generic artwork, limited scientific accuracy, and the more specific the figure, the more you end up drawing yourself.
- Best for: posters, slide decks and outreach material where the visuals are illustrative rather than technical.
4. Inkscape
Inkscape is a free, open-source vector editor. Everything is under your control: paths, strokes, gradients, text, and export to SVG, PDF or PNG at any resolution. That control is also the cost. A clean labeled cell diagram drawn from scratch is an afternoon of work for someone who knows the tool, and considerably longer for someone who does not.
- Strengths: true vector output, complete control over every element, no subscription.
- Limits: steep learning curve and slow for organic shapes. You draw every structure yourself.
- Best for: final polish of a figure you already have, and diagrams that must be vector for a print journal.
5. TikZ in LaTeX
TikZ draws figures from code inside your LaTeX document. Fonts match the manuscript, labels can contain real math, and the figure is reproducible because it is text. It shines for schematics, geometry, flowcharts and plots. It is the wrong tool for a shaded illustration of a cell or an organ, where a hand-written path for every membrane would take days.
- Strengths: perfect typographic consistency with the paper, math in labels, version control friendly.
- Limits: code-only, slow to iterate visually, and unsuited to organic illustrations.
- Best for: block diagrams, geometric constructions, commutative diagrams and anything that belongs in the source.
If you have a sketch already, the image to TikZ converter turns it into TikZ code you can refine.
How to choose
- Need a labeled biology or math illustration for a paper or class? Use Figure Maker. It is the only option on this list that produces a drawn, labeled figure you can still edit.
- Need a schematic that lives in your LaTeX source? Use TikZ, and generate a first draft from a sketch if you have one.
- Need a poster or slide layout? Canva is quick. Bring your scientific figures in as images rather than building them from its icons.
- Need to polish a finished figure to vector? Inkscape.
- Just exploring what a figure could look like? A general image model is fine for a sketch. Do not submit its text.
Frequently asked questions
Can AI-generated figures go in a journal submission?
It depends on the journal. Most publishers now have an explicit policy on generative images, and several distinguish explanatory illustrations from data figures. Check the current author guidelines for your target venue before you rely on any generated artwork, and verify every structure and label yourself.
Which format should I export?
PNG at the size the figure will be displayed is enough for slides, lecture notes and most manuscripts. If a journal requires vector artwork, redraw or trace the figure in a vector editor. Our export guide walks through resolution and sizing.
Is there a free way to get a labeled cell diagram?
Yes. The Figure Maker diagram library has labeled and unlabeled plant, animal, prokaryotic and eukaryotic cell diagrams you can download and use in class, and the example figures open free in the app.
Try it free
Make the figure that makes it click.
Open a labeled cell diagram, change the labels to match your lesson, and export a PNG for your slides or paper.
Starter examples are free to open. AI generation and edits use credits.

Practical tools for academic writing, document conversion, and research workflows.
Go to appContact usAsk AI about Underleaf
© 2026 Underleaf. All rights reserved.