
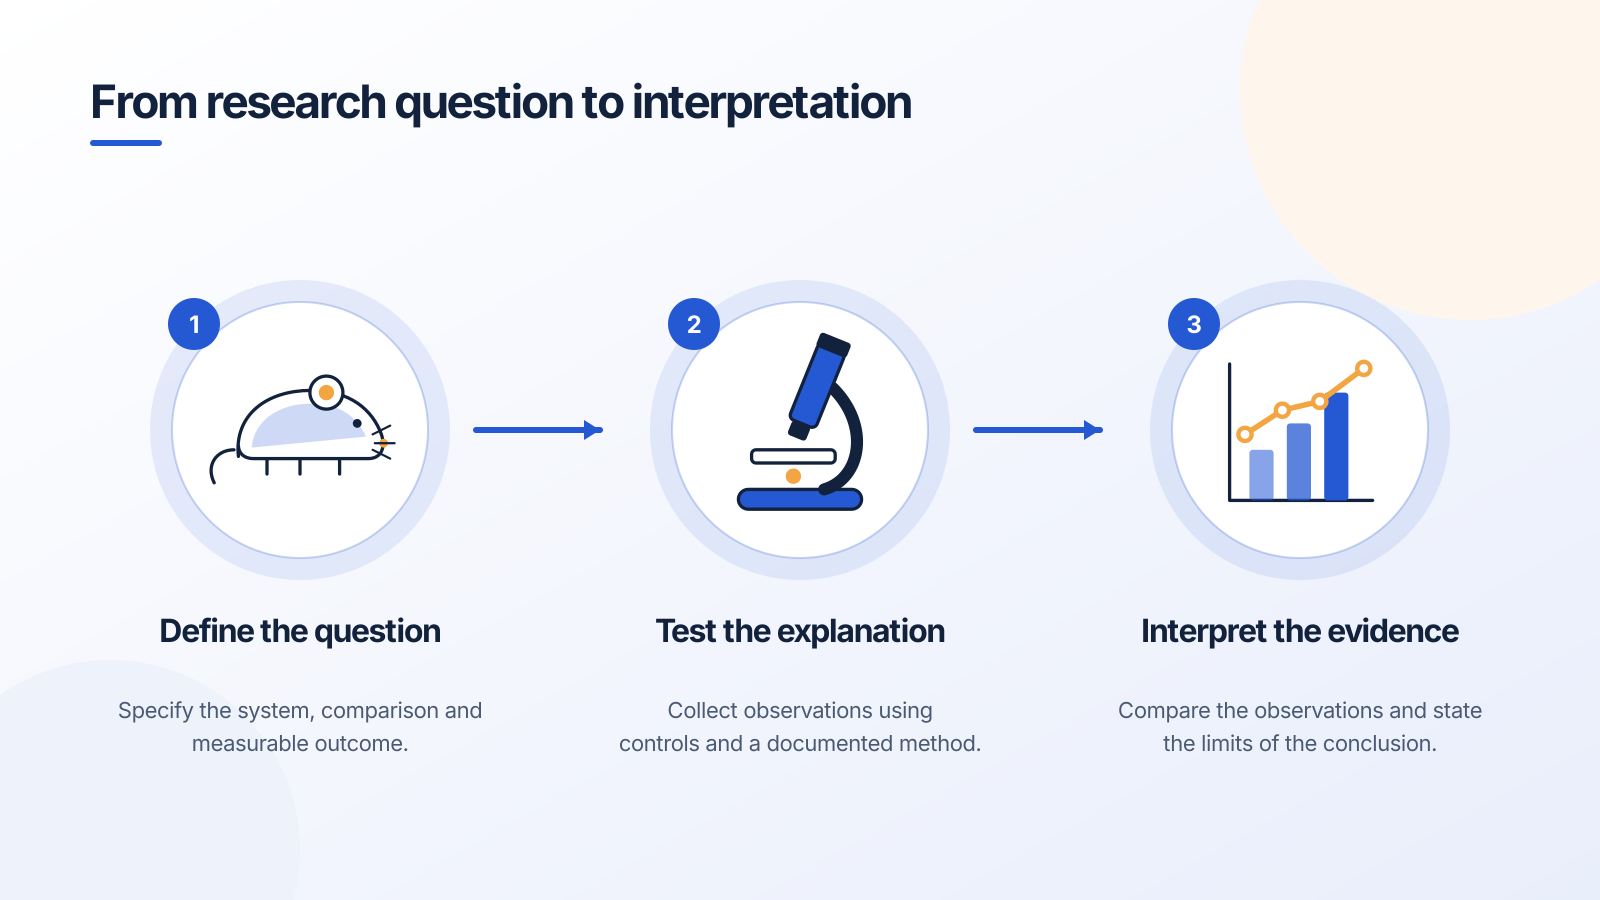
A planning template. Its statements describe work to perform and do not represent a completed experiment.
An experimental workflow diagram should make the sequence and dependencies easy to follow. It is especially useful when a paragraph of methods leaves the reader unsure which stage happens first or which samples feed a later analysis.
Start with the few stages that define the experiment. Add a branch only when it reflects a real comparison, control or decision. The template above deliberately begins with a simple structure.
Adapt the stages to your actual method
Replace the generic question with the system and comparison you study. In the method panel, identify the key preparation or measurement rather than compressing every procedural detail into one box. In the last panel, describe the planned analysis or the supported interpretation.
If the sequence has not been completed, call it a proposed workflow. If a stage depends on a quality check, show the decision explicitly rather than implying that every sample proceeds automatically.
Keep controls and sample identity visible
A control group is meaningful because of its relationship to another group. Use consistent labels across the diagram and caption so the reader can track that relationship.
Do not add a control, replicate count or statistical test because a template seems to need one. The diagram should reflect the documented study design. If the figure becomes crowded, split the sample flow from the analytical workflow.
Use the same structure for a lab meeting and a draft
For a lab presentation, reduce the steps to those needed for the discussion. For a manuscript methods overview, retain the distinctions the reader needs to understand the experiment. Keep the order stable across versions.
Open the free graphical abstract builder to change the text directly. Continue in Figure Maker when you want to refine the layout or explore additional explanatory elements.
A prompt to start from
Frequently asked questions
References and further reading
Illustrations are explanatory models. Colors, proportions and selected structures are simplified to support the topic.
Keep exploring
Try it free
Start with a figure. Make it yours.
Open a starter, adapt the labels, and create an illustration for your next lecture or research discussion.
Starter examples are free to open. AI generation and edits use credits.