Underleaf Logo
Underleaf
Blog
Log InTry Free

Learn Figures

Guides

  • How to make a graphical abstract
  • How to create a scientific figure
  • Export scientific figures without losing clarity
  • Add your scientific figure to LaTeX
  • Make diagrams that teach one idea at a time
  • Write a caption that completes the figure

The Figure Maker field guide

Write a caption that completes the figure

Explain the system, panels, symbols and limits of an illustration so the reader can understand what the figure does and does not show.

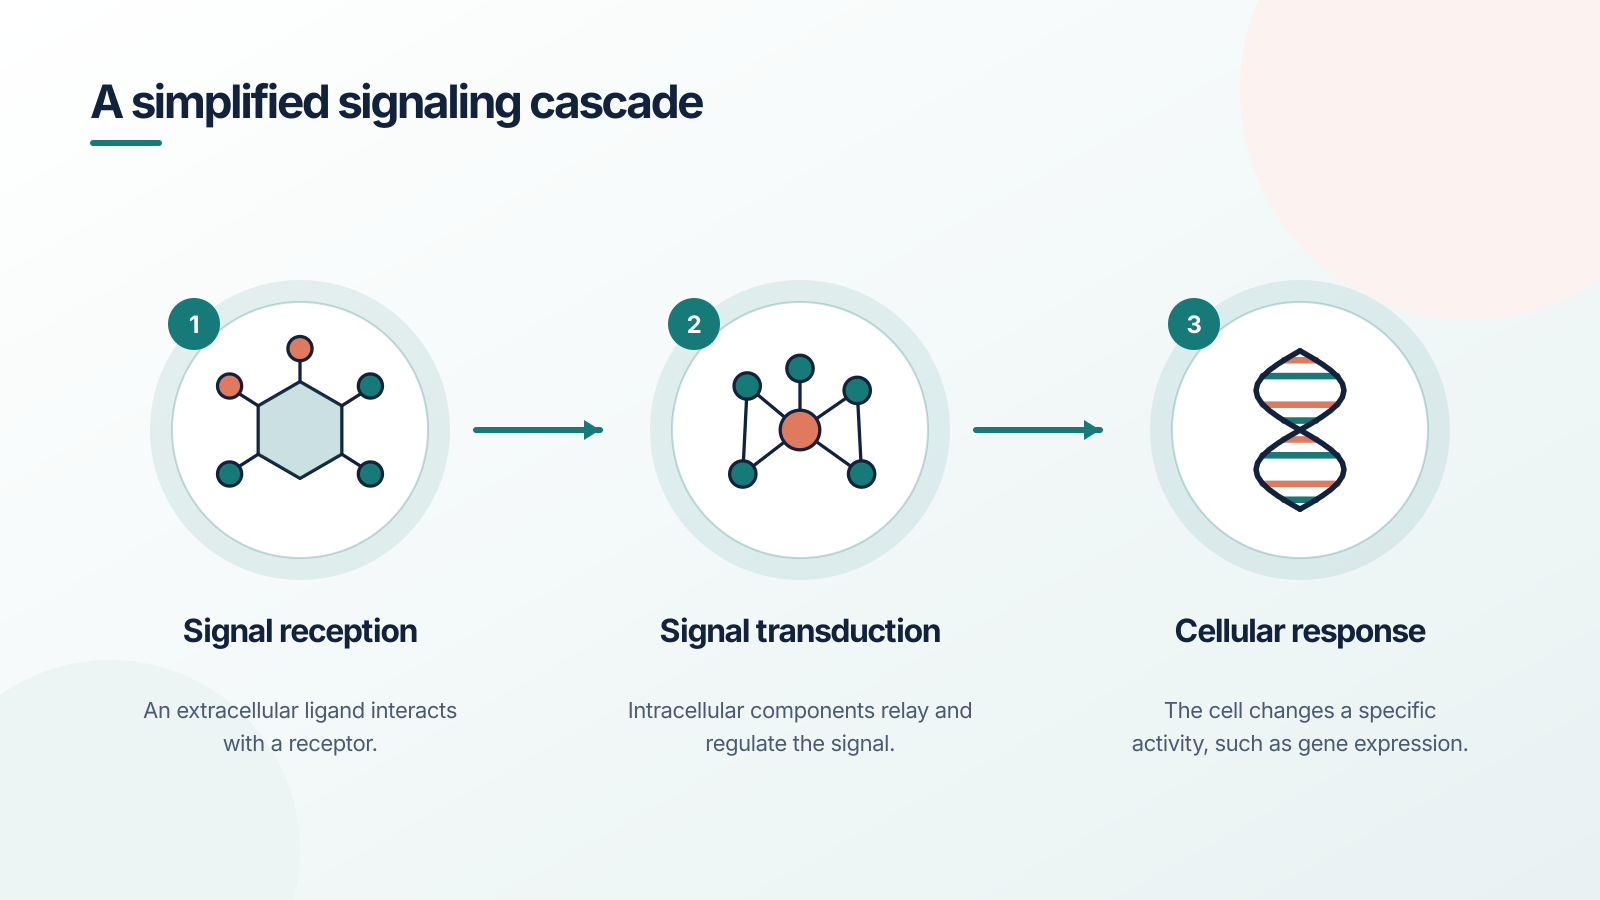
Three-panel overview of signal reception, transduction and cellular response
Download PNG

A simplified signaling overview. The arrows indicate reading order between broad stages; specific molecular interactions are not shown.

Customize this figure

A figure caption connects the visual with its scientific meaning. It tells the reader what system is shown, how to interpret the labels and which simplifications matter. A strong caption does more than repeat the title.

Write the caption while checking the figure. The need to explain an arrow or a color often reveals that the visual convention is unclear or that a label is missing.

A useful caption structure

Start with a short statement identifying the subject. Then explain the panels or relationships in the order they appear. Define abbreviations and symbols that a reader needs to interpret the picture. Finish with relevant qualifications, attribution or required disclosure.

For a data figure, the caption may also need the sample, method, uncertainty and statistical information required by the field or journal. An explanatory illustration should not imply that it contains measured data if it does not.

Caption examples for different figure types

Cell illustration: “Generalized plant-cell model with selected organelles. The cell wall is shown outside the plasma membrane. Colors and proportions distinguish structures and are not to scale.”

Process schematic: “Overview of a proposed experimental workflow. Samples proceed through preparation, measurement and analysis. Arrows indicate the planned sequence; no experimental outcomes are reported.”

Mathematical illustration: “Three connected closed orientable surfaces of genus 0, 1 and 2. The torus includes representative meridian and longitude loops. The drawings illustrate topology rather than metric properties.”

These are structural examples. Replace them with a description of the actual figure and add the attribution or disclosure required for your use.

Explain what the arrows and colors mean

An arrow can mean time, movement, causation, activation, mapping or simply reading order. Those meanings are not interchangeable. State the intended convention if it is not obvious from the field’s notation.

Color should support identification rather than carry the entire explanation alone. Pair important differences with labels, line styles or other accessible distinctions. If colors have no scientific meaning beyond separation, say so where it helps prevent misreading.

Caption and alt text have different jobs

A caption is part of the visible scientific explanation. Alt text provides an alternative for someone who cannot see the image. For a complex diagram, a short alternative may point to an adjacent longer description or a structured explanation.

Avoid using alt text as a list of search keywords. Describe the subject and the relationship conveyed. The parts tables on the diagram pages provide additional text that helps explain what the visual labels refer to.

Check caption and figure together

Verify that every panel name in the caption exists in the image, that symbols match, and that a stated direction agrees with the arrow. Remove claims that exceed the evidence or the scope of the illustrated model.

If AI tools contributed to the figure, follow the destination’s current disclosure requirements. Keep the tool information and creation history available so that you can describe the actual process accurately.

A prompt to start from

Adapt this signaling overview into a clean introductory schematic. Keep reception, transduction and cellular response as three separate stages. Use arrows only for the reading sequence and preserve short editable headings. Do not introduce named molecules or experimental results.
Use this prompt

Frequently asked questions

References and further reading

Illustrations are explanatory models. Colors, proportions and selected structures are simplified to support the topic.

Keep exploring

Try it free

Start with a figure. Make it yours.

Open a starter, adapt the labels, and create an illustration for your next lecture or research discussion.

Starter examples are free to open. AI generation and edits use credits.

Three-panel overview of signal reception, transduction and cellular response

On this page

For lectures, research discussions and your next scientific explanation.

Explore Figure Maker

The Figure Maker field guide

Write a caption that completes the figure

Explain the system, panels, symbols and limits of an illustration so the reader can understand what the figure does and does not show.

Three-panel overview of signal reception, transduction and cellular response
Download PNG

A simplified signaling overview. The arrows indicate reading order between broad stages; specific molecular interactions are not shown.

A figure caption connects the visual with its scientific meaning. It tells the reader what system is shown, how to interpret the labels and which simplifications matter. A strong caption does more than repeat the title.

Write the caption while checking the figure. The need to explain an arrow or a color often reveals that the visual convention is unclear or that a label is missing.

A useful caption structure

Start with a short statement identifying the subject. Then explain the panels or relationships in the order they appear. Define abbreviations and symbols that a reader needs to interpret the picture. Finish with relevant qualifications, attribution or required disclosure.

For a data figure, the caption may also need the sample, method, uncertainty and statistical information required by the field or journal. An explanatory illustration should not imply that it contains measured data if it does not.

Caption examples for different figure types

Cell illustration: “Generalized plant-cell model with selected organelles. The cell wall is shown outside the plasma membrane. Colors and proportions distinguish structures and are not to scale.”

Process schematic: “Overview of a proposed experimental workflow. Samples proceed through preparation, measurement and analysis. Arrows indicate the planned sequence; no experimental outcomes are reported.”

Mathematical illustration: “Three connected closed orientable surfaces of genus 0, 1 and 2. The torus includes representative meridian and longitude loops. The drawings illustrate topology rather than metric properties.”

These are structural examples. Replace them with a description of the actual figure and add the attribution or disclosure required for your use.

Explain what the arrows and colors mean

An arrow can mean time, movement, causation, activation, mapping or simply reading order. Those meanings are not interchangeable. State the intended convention if it is not obvious from the field’s notation.

Color should support identification rather than carry the entire explanation alone. Pair important differences with labels, line styles or other accessible distinctions. If colors have no scientific meaning beyond separation, say so where it helps prevent misreading.

Caption and alt text have different jobs

A caption is part of the visible scientific explanation. Alt text provides an alternative for someone who cannot see the image. For a complex diagram, a short alternative may point to an adjacent longer description or a structured explanation.

Avoid using alt text as a list of search keywords. Describe the subject and the relationship conveyed. The parts tables on the diagram pages provide additional text that helps explain what the visual labels refer to.

Check caption and figure together

Verify that every panel name in the caption exists in the image, that symbols match, and that a stated direction agrees with the arrow. Remove claims that exceed the evidence or the scope of the illustrated model.

If AI tools contributed to the figure, follow the destination’s current disclosure requirements. Keep the tool information and creation history available so that you can describe the actual process accurately.

A prompt to start from

Adapt this signaling overview into a clean introductory schematic. Keep reception, transduction and cellular response as three separate stages. Use arrows only for the reading sequence and preserve short editable headings. Do not introduce named molecules or experimental results.
Use this prompt

Frequently asked questions

References and further reading

Illustrations are explanatory models. Colors, proportions and selected structures are simplified to support the topic.

Keep exploring

Try it free

Start with a figure. Make it yours.

Open a starter, adapt the labels, and create an illustration for your next lecture or research discussion.

Starter examples are free to open. AI generation and edits use credits.

Three-panel overview of signal reception, transduction and cellular response
Underleaf Logo
Underleaf

Practical tools for academic writing, document conversion, and research workflows.

Go to appContact us

Company

PricingBlogTutorialsConference TemplatesConference Deadlines

Free Tools

Image to LaTeXExcel to LaTeXArXiv to LaTeXTikZ GeneratorLaTeX Table GeneratorCitation GeneratorThesis GeneratorChrome ExtensionAll Tools

Ask AI about Underleaf

Ask ChatGPTAsk ClaudeAsk Perplexity

© 2026 Underleaf. All rights reserved.